|
The BIG Exception: We
have looked at various exceptions to Mendel's ideas,
but they have mostly been cases that illustrate that
heredity is more complicated than Mendel assumed and
not really exceptions to his ideas of how genes are
transmitted. However, the exception we will take up
now is
a major exception to gene transmission as Mendel
envisioned it. Mendel assumed that genes are all
separate (independent) units of heredity, but in
actuality they are clustered together (linked) in
groups on chromosomes and therefore do not usually
obey his Law of Independent Assortment.
- Chromosomes and the
Chromosome Theory: Mendel proposed his
theories of gene transmission just before
chromosomes ("colored bodies") were discovered in
the nucleus by Walter Flemming, but Mendel had no
knowledge of them. Also, the events of mitosis and
meiosis were subsequently elucidated.
|
- The Sutton/Boveri
Chromosome Theory: In 1902 the Columbia
University graduate student William Sutton and
the imminent German scientist Theodor Boveri
independently proposed the theory that genes are
located on chromosomes. They reached this
conclusion because of correlations between how
genes and chromosomes behave when gametes are
being formed.
- Genes (Alleles) and
Chromosomes Both Occur in Pairs.
- Allele Pairs and Chromosome
Pairs Both Separate from Each Other and Enter
Separate Gametes.
- The Separation of Both Allele
Pairs and Chromosome Pairs Are Independent
- The Proof of the
Chromosome Theory: Thomas Hunt Morgan
created a research group called the Drosophila
Group at Columbia University (later moving to
Cal Tech) and it was from this group that many
of the important early discoveries in the new
field of genetics came. The first of these was
the proof of the chromosome theory in which
Morgan and Bridges showed that a certain gene
was on the X chromosome, and therefore the
chromosome theory must be true.
|
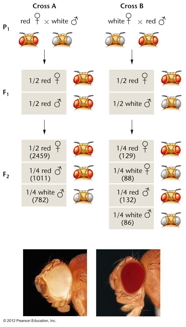
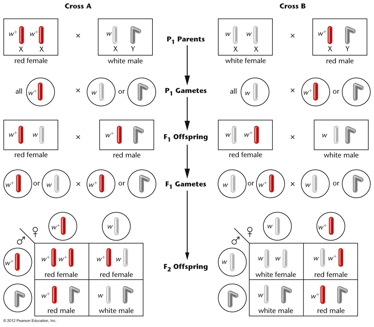
- Morgan's
Observations (1910): In one
cross, a female white-eyed fly crossed with a
male red-eyed fly produce females that were
all red eyed and males that were all white
eyed. When these F1 were crossed, they
produced a 1:1:1:1 ratio of red females :
white females : red males : white males.
The reciprocal cross also gave strange
results. By assuming that the white-eye gene
is on the X chromosome (X-linked), Morgan was
able to explain these strange results. (A
male, with just one allele, is not said to be
homozygous but hemizygous.)
- Bridges' "Final
Proof" of the Chromosome Theory:
In spite of Morgan's evidence, other
scientists were not convinced that the
chromosome theory was true until Morgan's
student, Calvin Bridges, showed conclusively
that the behavior of the white gene and that
of the X chromosome were correlated. His
experiment involved a rare event called
non-disjunction and produced an XXY female. In
the various sex chromosome combinations that
resulted from these females, the X chromosome
and the white gene seemed to be transmitted
together. (This proof was the first article in
the first volume of the journal
Genetics.)
|

|
- X Linkage in Humans:
Genes on the X chromosome are said to be X
linked. (Sex-Linked vs. X-linked
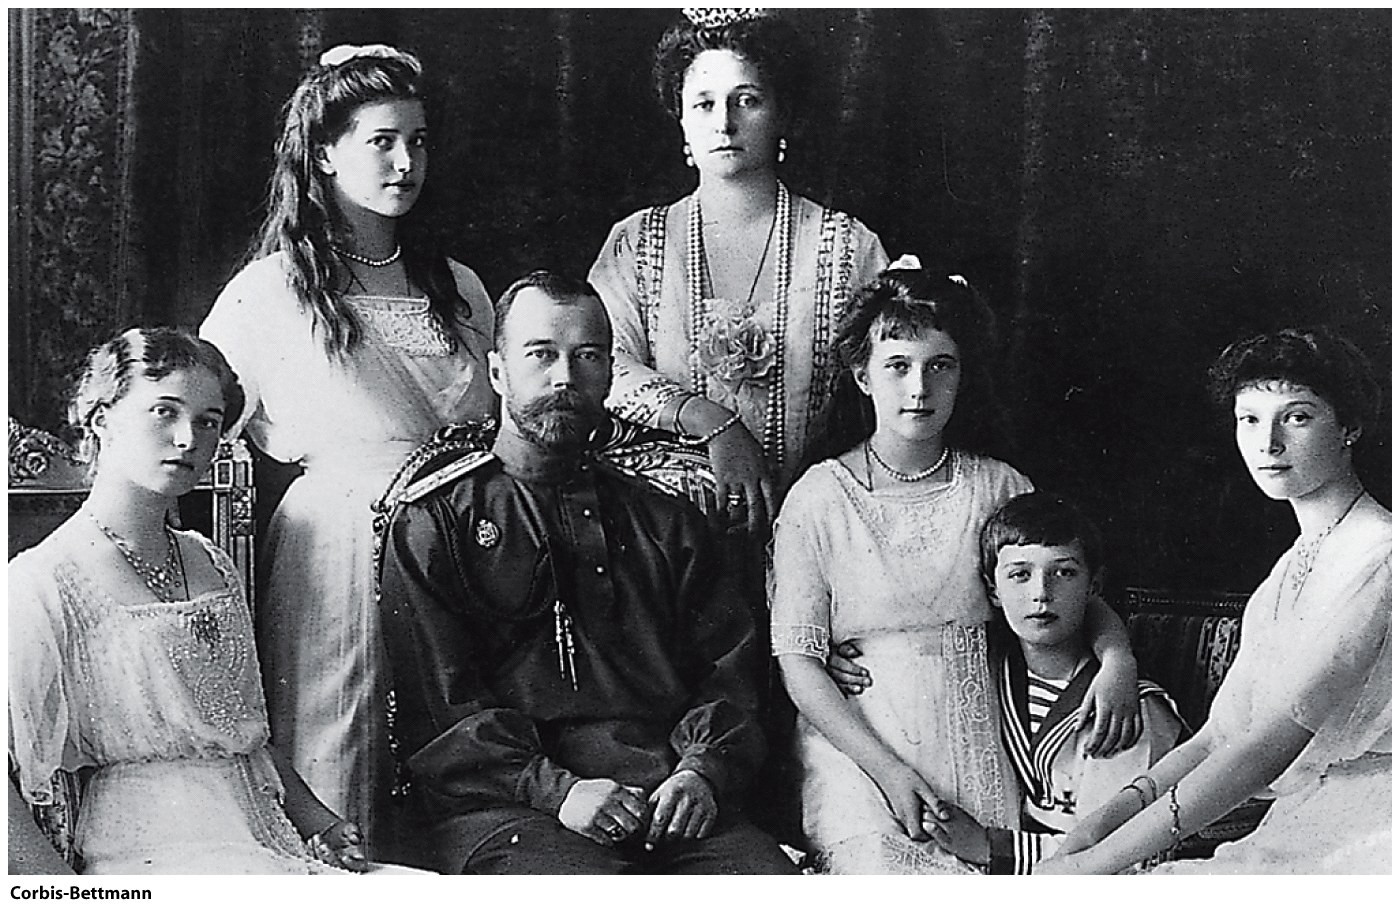
genes) Human traits like hemophilia A
and red-green colorblindness are inherited just
like white eye-color in Drosophila is.
Hemophilia A is a bleeding disorder due to
reduced activity of coagulation factor VIII.
(Various mutations in the factor VIII gene can
cause hemophilia A.)
- Sex-Linked Genes:
A gene on a sex chromosome (either the X or Y)
is a sex-linked genes. However, since there
are few genes on the Y chromosome, many refer
to X-linked genes as sex-linked genes.
- X-linked Genes:
These are genes on the X chromosome (other
than on the pseudoautosomal reagions (PARs)
of the X) and show the inheritance pattern
described above. There
are two PARs on the X, one at the tip of
each telomere. The
X's PARs are homologous to the Y's PARs and
crossing over can occur between them. [What
is distinctive about a sex chromosome?]
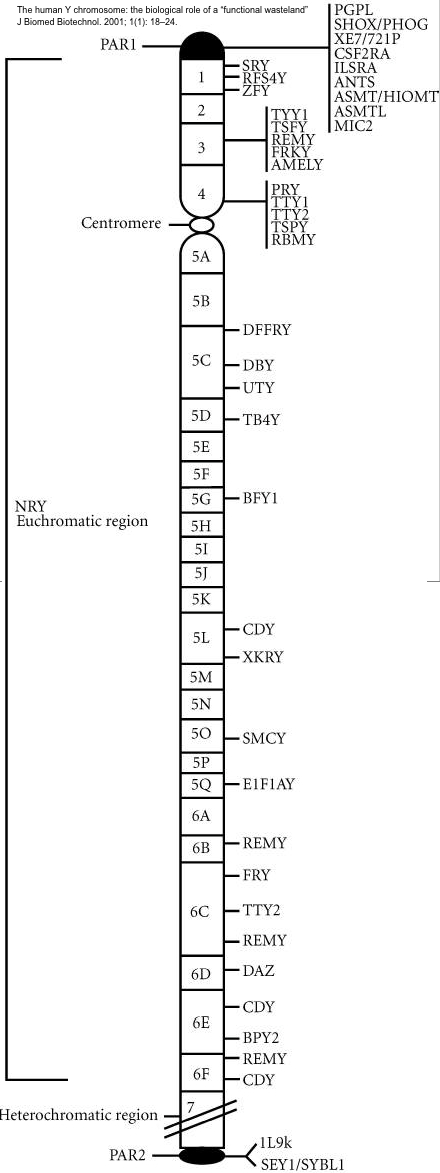
- Y-linked Genes:
These are genes on the NRY (non-recombining
region of the Y) -- that is, on the Y
chromosome other than the PARs of the Y. (Y chromosome
:-))
Like for the X, there are two PARs on the Y,
one at the tip of each telomere.
  |

|
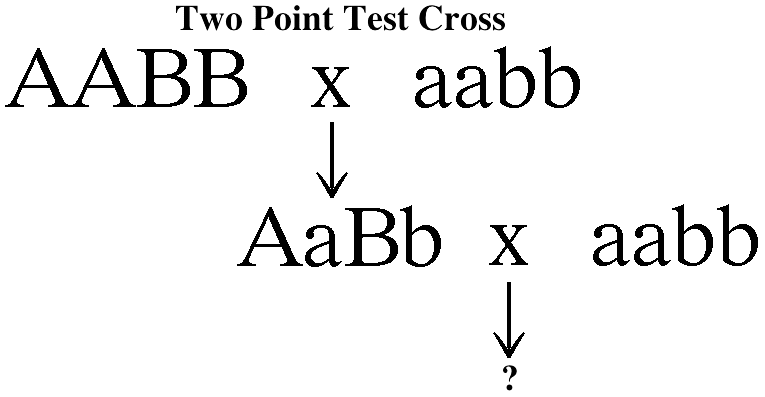
- Linkage and Mapping:
Genes are on chromosomes. Alleles are found at the
same site, or locus, along the chromosome. Since
more than one gene is located on each chromosome,
two genes that are on the same homologous pair of
chromosome will not obey Mendel's Law of
Independent Assortment. That is, the segregation
of one of these pairs of alleles will not be
independent of the segregation of the other pair
of alleles. Two alleles that are on the same
chromosome will tend to move together into the
same gamete (the segregation of one pair of
alleles does
effect the segregation of the other pair). This
phenomenon is called linkage. This means for a
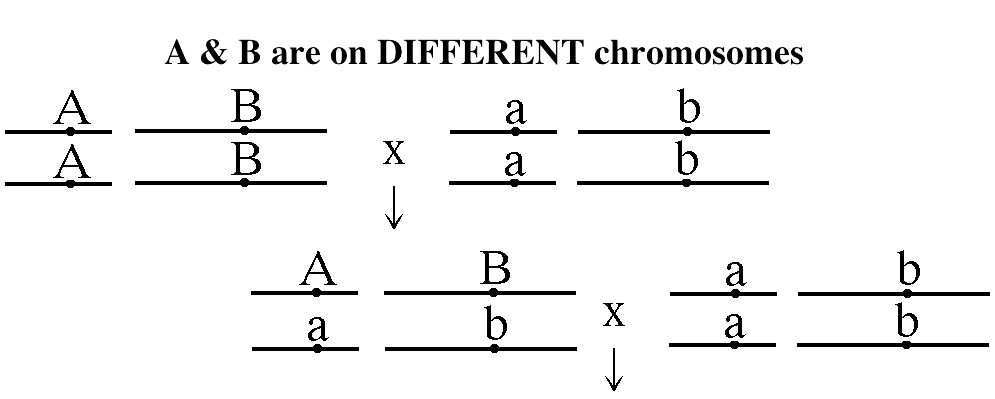
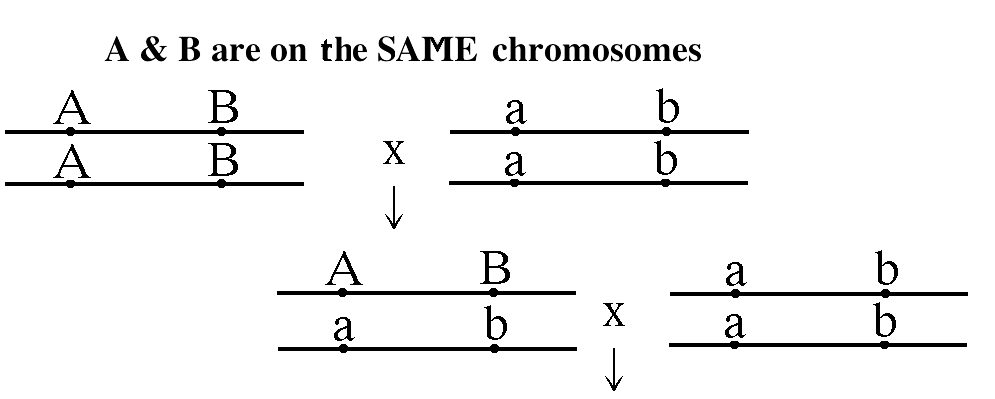
two-point test cross, there are two possibilities.
|
 |
   |
- Parental and Recombinant
Gametes: When considering a typical
dihybrid cross, the gametes that the F1
individual makes will be of two types: 1)
gametes that have the same combination of
alleles as the P generation individuals, called
parental gametes and 2) gametes that have the
opposite combination of alleles as the P
generation individuals. (In order to determine
what proportion of the gametes were parental or
recombinant, a test cross is performed.)
- Independent Assortment
versus Linkage: If two genes are on
different chromosome pairs, they will assort
independently. That is, the number of parental
gametes will be approximately equal to the
number of recombinant gametes. If, however, two
genes are located on the same chromosome pair,
they will not assort independently but rather
will be linked (they will show linkage). That
is, the number of parental gametes will
(usually) be significantly greater than the
number of recombinant gametes (the product of
crossing over).
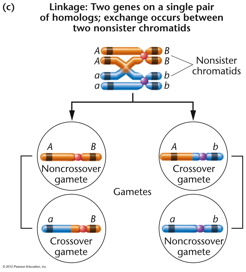
- Recombinant Gametes and
Crossing Over: For linked genes,
recombinant gametes are produced by crossing
over occurring between the two genes. (Where do
they come from for unlinked genes?) Even if a
crossover occurs between the two genes, the
products of a single meiotic event will be two
parental and two recombinant gametes. The proof
that recombinant gametes were the product of
crossing over came from cytological studies that
correlated chromosome changes with recombinant
gametes. (McClintock
Paper)(Chiasmata)
- Predicting the Outcome of
a Dihybrid Cross Involving Linked Genes:
In order to predict the outcome of a dihybrid
cross involving two linked genes, the Punnett
Square can be used. However, beside listing the
types of gamete genotypes, the probability of
each gamete occurring must be listed. This
probability can be calculated if you know the
distance between genes since the distance
predicts the percentage of recombinant gametes.
Then, when filling in the Punnett Square,
besides combining the gamete genotypes, the
probabilities of the gamete pairs are multiplied
together, yielding the frequency of each
genotype. (Problem
Solving: see the second half of the LINKAGE
tutorial video showing how to solve this
type of problem.)
- Gene Mapping: For
linked genes, the distance between the two genes
is proportional to the frequency of crossing
over. The further apart two genes are, the more
likely it is that a crossover will occur between
them (crossovers occur at random, more or less).
For this reason, the percentage of recombinant
gametes can be used as a relative measure of the
distance between two linked genes. One percent
recombinant gametes is defined as one map unit
(mu) or centi-Morgan (cM). The distance between
two genes can be measure this way. (Problem
Solving: see the first half of the LINKAGE
tutorial video showing how to determine if
two genes are linked.) Also, the distance
between three (or more) genes can be measured by
determining the distance between each pair of
genes (by performing a series of two-point test
crosses). The maximum distance between two
genes as measured by a two-point test cross
is 50 cM (you can't get more than 50%
recombinant gametes). This means that the two
genes are so far apart that crossing over will
always occur between the two. (Also, 2-strand
double crossovers will go undetected.) However,
by performing a series of test crosses, two
genes may be measured to be further than 50 cM
apart (by adding the pair-wise distances).
- The Three-Point
Test Cross: Since two-point test
crosses often overlook double crossovers, the
standard tool of gene mapping is the three
point test cross. (Many genes in organisms
like Drosophila
have been mapped. A gene's position on a
chromosome is its locus.) A heterozygote for
three linked genes is crossed to an individual
homozygous for all three recessive alleles.
Analyzing the progeny reveals the gene order,
the distance between the genes, and the degree
of interference. Here are the steps in
performing a three-point test cross. (Problem Solving: see the THREE
POINT TEST CROSS tutorial video showing
how to analyze data from such a cross.)
- Determine the Gene Order:
Determine the two classes of gametes that
are parental. These will be the
complementary pair that is the most
numerous. Next, determine the two classes of
gametes that are the result of double
crossovers. These will be the complementary
pair that is least numerous. Then, decide
which pair of alleles of the double
crossovers needs to be switched (inverted)
to give the parental configuration. Place
that pair in the middle and you have the
gene order.
- Determine the Distance between the
Genes: First (don't
skip this step), rewrite the data
with the genes in the right order and
grouped into complementary pairs. Then, by
comparison with the parental configuration,
determine which pair results from a
crossover between the first two genes. Add
these two together plus the double
crossovers and divide by the total. Multiply
by 100 to change to percent recombination.
This number is the distance between the
first two genes in cM. Repeat the process to
determine the distance between the second
and third gene.
- Calculate the Coefficient of
Coincidence: When a crossover
occurs, it interferes with the occurrence of
a second crossover nearby. The degree of
interference is calculated as the
coefficient of coincidence. This is a
decimal that expresses what proportion of
the expected double crossovers actually
occurred. A coefficient of coincidence of
1.0 means there is no interference. A
coefficient of coincidence of 0 means that
there is complete interference (no double
crossovers occurred). In Drosophila,
for genes less than about 10 - 15 cM apart
(the distance between to two outside genes
in a 3-point test cross) there is complete
interference. To calculate this decimal,
calculate the actual proportion of double
crossovers from the data and divide it by
the expected proportion of double
crossovers. The expected proportion is the
product of the probabilities of each
individual crossover probability (the
distance in cM converted to a decimal).
- Mapping in
Organisms with an Ordered Tetrads:
Ascomycete fungi produce an ascus which has
all four products of a single meiosis in a sac
(called a tetrad). In some ascomycete fungi,
these cells are maintained in the order in
which they were produced by meiosis I and
meiosis II (although a mitotic division of
these spores occurs after meiosis so the ascus
has 8 cells, not 4). This is called an ordered
tetrad. In this case, it is possible to map
the distance a single gene is from its
centromere, since (in a monohybrid cross) if
no crossover occur between the gene and its
centromere, the two "top" meiotic products
should have the same genes and the two
"bottom" products should have the alternate
gene. Neurospora
is such a fungus that has been extensively
used as a model organisms. (We will use a
relative called Sordaria in lab to map a
gene's distance from its centromere.)(Problem Solving: see the ORDERED
TETRAD tutorial video showing how to map
a gene's distance from its centromere in such
a cross.)
|
|
|
- Somatic Cell
Hybridization: This technique was
used in the 1960s to map some human genes to
chromosomes or even regions of a chromosome.
Somatic cell hybridization involves fusing a
human tissue culture cell with a mouse cell.
In these cells, if the nuclei fuse, human
chromosomes are preferentially lost, it is
possible to get a cell that has all mouse
chromosomes but only one human chromosome. If
that cell still produces a specific human
product (like a protein), then the gene
for that protein must be on the remaining
human chromosome. If other combinations are
encountered, then it may be possible to infer
the locus of the gene.
|
|
|
- FISH
(Fluorescent in situ Hybridization):
This techniques involves hybridizing a probe
DNA molecule (tagged with a fluorescent
marker) to a spread of chromosomes. See this
link.
- SNPs
(Single Nucleotide Polymorphisms) and
GWASs (Genome-Wide Associated Studies): These
methodologies use common variants of a single
DNA base pair as markers to hunt for genes
related to a trait or disease. (SNP
link; GWAS
link--see especially "How are
genome-wide association studies conducted?")
- LOD Score:
Pedigree analysis of human traits can be used
to infer linkage of two genes. The calculation
involves estimating the probability that a
specific pedigree was produced by two genes
linked at a given distance versus the
probability the pedigree was produced by two
non-linked genes. (This is repeated for
various distances.) This LOD score (log of the
odds favoring linkage) is used to decide
whether or not two genes are linked and to
estimate the distance between them if they
are. The highest LOD score gives and estimate
of the distance. (Details of how to calculate
LOD scores will not be on the test, but those
of you headed toward medical school should
take a look as this
explanation of how to calculate LOD
scores.)
|
chtheorylink_files/css3menu18/bhome.png) Home
Home


